Project Description


"This blog is updated by the JISC funded G3 Project (#jisc3g) team. We are building an framework for teaching and communicating relevant geographic concepts and data to learners from outside the world of geography and GIS. We think this blog will be of particular interest to those working or teaching in HE and FE and those interested in teaching and learning and e-learning."

|Read more about the project |

Wednesday, 2 November 2011

Yes, it is Possible to do a PhD in GIS without including any maps (or, what makes spatial speical - Claire's view)

Kate's post (below this one) provides a very good insight into what makes spatial special - for her, a "picture is worth a 1000 words". When we were discussing the post, however, I thought I would also propose a complementary view. I guess my equivalent sentence would be "you may not need a map at all". Indeed, for me "spatial" would also include these:


and also these:


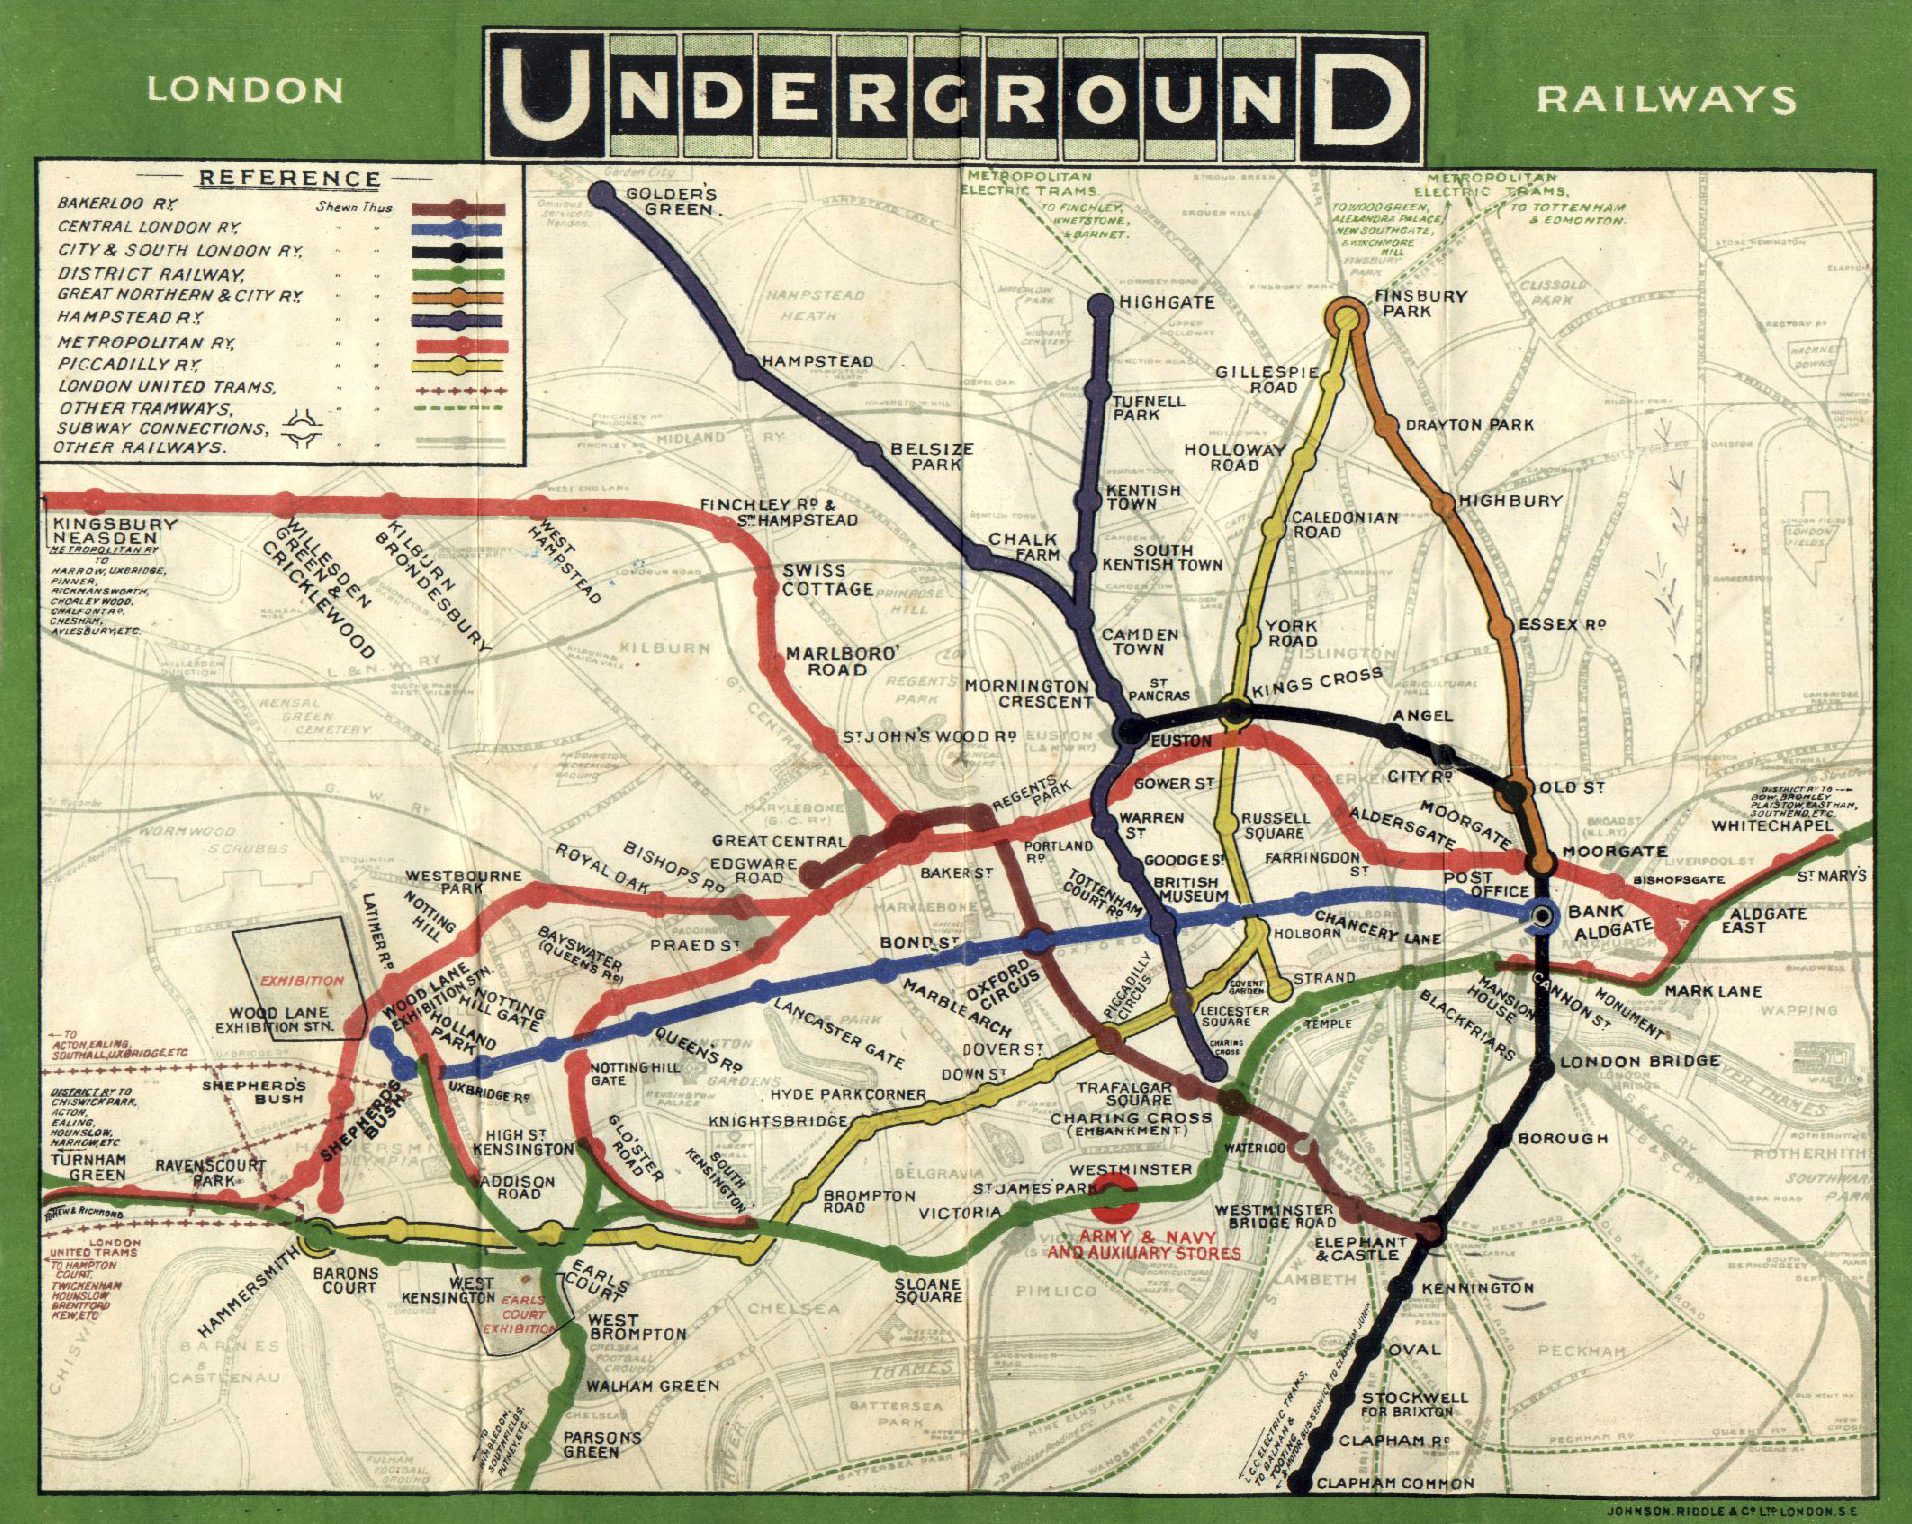
Working with spatial data offers a different way to understand your data that you couldn't achieve in a simple spreadsheet or text-based approach. In addition to that, 'spatial' for me goes beyond traditional geographical scales. You can look for different patterns, and answer questions such as 'what lies within 30km of here?' or 'what is next to this building?' or 'I want to build a new underground tunnel - who owns the land above me?', 'How can I get from A to B on the Underground?' If I had to list what makes spatial special, the list would focus more on what you can do with data in a GIS that you can't do elsewhere, which might include:
  • topological operations - e.g. containment, intersection, adjacency, meets, touches
  • networking operations - e.g. shortest path, travelling salesman
  • metric operations - e.g. distance, area, volume
  • topological consistency analysis - e.g. does the data have holes, slivers, undershoots and overshoots
and potentially others such as pattern detection, statistical analysis, spatio-temporal analysis and so forth. The results of this analysis may be presented as a map, but may be given in another form - a journey planner gives you a list of waypoints for your route, the population within a London Borough may be given as a number in a report.


If you think about it, Kate's view and mine have quite a bit in common, and probably reflect our different specialisations - amongst other things, Kate is a Usability and Human Computer Interaction expert, whereas my work focusses more on databases, 3D GIS and back-end programming. No doubt there are many more answers to the 'what makes spatial special' question too.


And for those of you who are interested - my PhD was about performance of topological analysis in 3D GIS. Here's an example of the visual output:


Images from:
  • http://upload.wikimedia.org/wikipedia/commons/9/90/Tube_map_1908-2.jpg
  • http://activerain.com/image_store/uploads/1/9/9/6/2/ar126056378926991.jpg
  • http://t2.gstatic.com/images?q=tbn:ANd9GcQJvI_BjNgt2QSkemv5E7X7Nparv2mb1Bpvt52aErg2C-bnsRoE0w
  • http://t0.gstatic.com/images?q=tbn:ANd9GcSbpUkXUCwxAaA6vWC04xVsAcpofaC9XbZYjF6BoPFG4OBaa7_O


Friday, 14 October 2011

What Makes Spatial Special – my (Kate’s) perspective

When I started on our master’s degree in 2003 at University College London the first week was an induction week. We were introduced to each lecturer in the department (Prof Muki Haklay, Prof Paul Longley, Jeremy Morley and Dr John Illife) and were giving an introductory series of lectures called spatial is special – I still remember them reasonably well. The notion of spatial is special is one of the first discussions included in GIS texts and introductory lectures. So, let’s consider the conventional reasons for why spatial is special, they include:

  • Geographic data is multi dimensional
  • There are lots of it – it is voluminous
  • It can be represented at multiple scales
  • It requires a projection system to turn a 3D real world into an 2D computer model or paper map
  • Special analysis techniques are required – nearest, furthest etc
  • It can be laborious and time consuming to collect, process and analyses
  • It is expensive and complex to maintain up to date geographic data
  • I t is cross –disciplinary in nature and can be used to link disciplines

(adapted from Longley, Goodchild, Maguire & Rhind (2011). Geographical Information Systems and Science, John Wiley and Sons: Chichester)

This is the technical response, but there is an emotive reason behind why spatial is special, and for me it is related to the age old adage “A picture tells a 1000 words”. Here in Portsmouth I teach to undergraduates in lectures with 200 students. I see my job as inspiring enthusiasm for exploring issues in human geography and I do this by finding relevant maps, images and TED talks to bring subjects/sub-disciplines to life.

For reasons unbeknown to me, there is a consensus amongst our undergraduate cohort that they don’t like GIS/ Geospatial data/ making maps. This bothers me, I am a map geek and I hope to inspire them to change their mind. So, even if the students don’t remember my name, they know me as the one that uses a map(s) in every lecture. Why do I do this? Good maps bring abstract concepts, theory and data to life. They help stimulate the imagination and aid knowledge production. They simplify and generalise complex issues in ways that members of the public and new learners can understand. It is inconceivable for me to imagine giving a lecture on migration without the aid of maps to illustrate movement.

How do I benchmark a successful lecture with 200 students? Students are not fiddling with their phones, whispering to each other, falling asleep or slouched in their seats. If they are engaged, attentive and interested it shows on their faces and in their posture. Last year, I remember giving a lecture on the subject an “Introduction to GIS and health”. There are so many powerful maps that can be used in this subject area, examples include:

  • John Snow’s map of Cholera
  • Changes in life expectancy as you travel from tube stop to tube stop
  • Patterns of malaria across Africa
  • Sptaial-temporal maps of population differences
  • Noise mapping in low income neighbourhoods of London
  • Mapping Internally Displaced People (IDP) in Haiti
  • Cartograms of population to reveal inequalities


When such maps are used in lectures to illustrate and communicate concepts and bring geographic data to life – the reward is a positive student reaction and a realisation that maps are useful. This is particularly evident if lectures reflect real world issues in the news. This lecture was delivered this year at the time of the during this lecture we also discussed the Fukushima nuclear accident in Japan – highlighting health issues of such a crises and then looked at how different maps and mapping hacks of the incident could be used to explore at risk population groups. This type of linking between maps and real world issues bring to the fore the potential of geospatial applications for decision-making and problem solving issues in human geography.


Monday, 12 September 2011

IIGLU - how usable will it be?

By now if you have been following the blog you will know that the team are interested in the usability of geospatial technology and that we are developing an e-learning environment for teaching and supporting the learning of geospatial concepts. Hence, the blog post an IIGLU is born. IIGLU is the name of our tool and stands for Interactive, Integrated, Geospatial, Learning and Understanding. We like the name IIGLU because in its other sense an igloo is a construction that uses building blocks to slowly build up and develop - rather like the teaching geospatial concepts where complex ideas are broken down into smaller parts. IIGLU has two components one where teachers can record their tutorials and one where the students access the tutorials and play them back.

In a previous blog post I discussed the Child of 10 usability standard. The idea behind which is that a child of 10 can do something in 10 minutes. We have considered this standard throughout the development of the IIGLU application. What you see in the sneeky preview is prior to the CSS and the interface design scripting. Patrick, our developer is working on this as we speak.

For students using IIGLU it will be straightforward and intuitive to use without requiring any help documentation or instructions. Students should be able to log in, select a scenario or geographic concept and then work their way through the tutorial steps using a simple next or back button. Simplicity is the underlying premise. We have placed priority on the user friendly development of this component.

We have also given priority to the geospatial concepts and knowledge building process and not to the complex interactions with the map. Therefore, 3 types of multimedia are currently supported: HTML, Map, and You Tube Video. So there is this great video from the TV series West Wing all about the distortions that result from map projections: it is the perfect way to introduce new learners to map projections (see previous post on reflections of teaching map projections). The e-learning environment will enable complex geospatial concepts to be presented without the frustrating interactions required with learning with a desktop GIS.

Thursday, 25 August 2011

An IIGLU is born, or a project development and brand update

This is the first one of the overdue development activity updates from the JISCG3 project. I have been busy over this summer with the development of the web interface, which we now christened IIGLU. The idea of IIGLU comes from “Interactive Integrated Geospatial Learning and Understanding” (to be honest, the second I only comes so we could grab the most popular domains!). This name is a take on the word Igloo, which is made of large building blocks representing the different steps of geographical understanding in our tutorial. Conveniently, an igloo is also sort of shaped like a globe/earth, returning the focus to gegography!

With the name set then, we are now ready to release a first demo of the tool, which I quickly put together this afternoon and recorded in this screencast:


As you can see from the video, we now have a functionally complete web-environment, where registered users can create new interactive tutorials, and classify them in different overarching scenarios. Each tutorial consists of a series of 'states', using different mediums such as rich text, videos, and most importantly an interactive web-mapping environment. The idea with the states is that we can provide in each tutorial a set of anchor points to which a learner can return if they get lost, all the while preserving a rich interactive user experience, especially when it comes to the web-mapping. Further development of functionality will focus on the inclusion of more spatial functionalities, as well as thematic formatting, to make this a much more rich environment encompassing a wide range of geographic concepts.

There are still plenty of rough edges to trim, and we need to put a nice face on the functional interface. We have just completed the design of a website logo, and will attack the styling of the User Interface this week. So hopefully, in a couple weeks time, I will be able to give a much more polished presentation of the system!

Technical Development details (warning, geoweb-geekiness ahead!!):
The technical design of the tool consists of two major components:
  • Server-side framework (we used GeoDjango, a spatially aware web development framework as the basis). The server manages the user and tutorial creation, editing and management, and serves all the tutorial data and connected spatial datasets for use by the client in a standards compliant manner (GeoJSON), with all the data residing on a PostgreSQL + PostGIS database.
  • Client framework (developed in JavaScript/JQuery) enables a rich user interaction experience, with a dynamic and fast guidance of the user through the tutorials, and efficient tracking of the user state and progress through the tutorial.
You might notice that we use OpenLayers as our mapping library, which slightly contravenes the previous conclusions we arrived at in this project regarding appropriate web-map API's. These conclusions reached previously about ease of development and deduplication of effort, achieved by reusing legacy codebase from different projects, were rendered irrelevant after switching to a structured web development framework, ie (Geo)-Django, and enabled us to use OpenLayers instead to take advantage of greater capabilities and openess of this library.

Wednesday, 10 August 2011

What is today’s equivalent to Jon Snow’s Map?


The question that was raised by James Reid from JISC during the workshop I was leading at the open geo health event. I would be interested to hear what the readers of this blog think? The workshop was discussing “why GIS is under-utilised in the NHS?” The term GIS in this sense is probably better replaced by location or spatially enabled technology as it encompasses the extent and breadth of contemporary desktop/web/mobile technology.

The question, “What is today’s equivalent to Jon Snow’s Map?” has resonated with me and got me thinking. To consider the answer to this question – we must first understand why the map of cholera deaths is so important: Here are my initial thoughts:

  1. Example of an early GIS – on paper with different layers (pumps, deaths, location of water companies and places of interest such as brewery/ poor house/ plague burial plot).

  2. Represented a paradigm shift in thinking related to cholera transmission – by providing an evidence base for the theory that Cholera is transmitted by water and is not air-borne.

Is there a modern health mapping equivalent? In the world of Volunteered Geographic Information (VGI) and humanitarian aid for which health is a component, I would propose that the crowd-sourced mapping of Hati has had considerable impact with a group of volunteers creating geographic data by tracing up-to-date satellite imagery and using the resulting data to develop applications for use by crisis responders.

In the field of Health, there are two other applications that come of the fore: Health Maps and EpiCollect. Health Maps began in 2006 and aggregates content from resources such as the World Health Organisation to provide real-time information on emerging infectious disease outbreaks. The recently developed EpiCollect is a mobile application tool that facilitates the collection of user content via questionnaires or surveys. Both of these initiatives are useful but whether they are the modern day equivalent of John Snow – I am not sure.

Monday, 8 August 2011

Open, Geo, Health Workshop: GIS in the NHS

I am leading a workshop at the Open, Geo Health Workshop in Edinburgh - #gecohealth. This is a JISC organised event.

I am hoping to encourage a discussion related to the future role of GIS in the health (NHS). As a researcher not only in usability I have a special interest in Health and Health inequalities.

It has long been my belief that GIS is under-utilised in the NHS. So whilst there are lots of new opportunities for Geo and Health - we need to identify what really needs to change to embed practice within the NHS. Whilst now more than ever before GIS is more affordable and more accessible with lots of useful data that can be applied to the health care setting - many barriers (social, political, technical, economical) still exist. The technical merits and low cost of Open Source Software are not enough to drive a georevolution within the NHS.

I see a number of the geospatial projects JISC have recently funded as having a future potential to aid decision-making in health. One of which is our project. Once the G3 project software is launched in October, I will develop a scenario around Geographic Concepts and health inequalities and hope that it will prove useful to health care professionals.