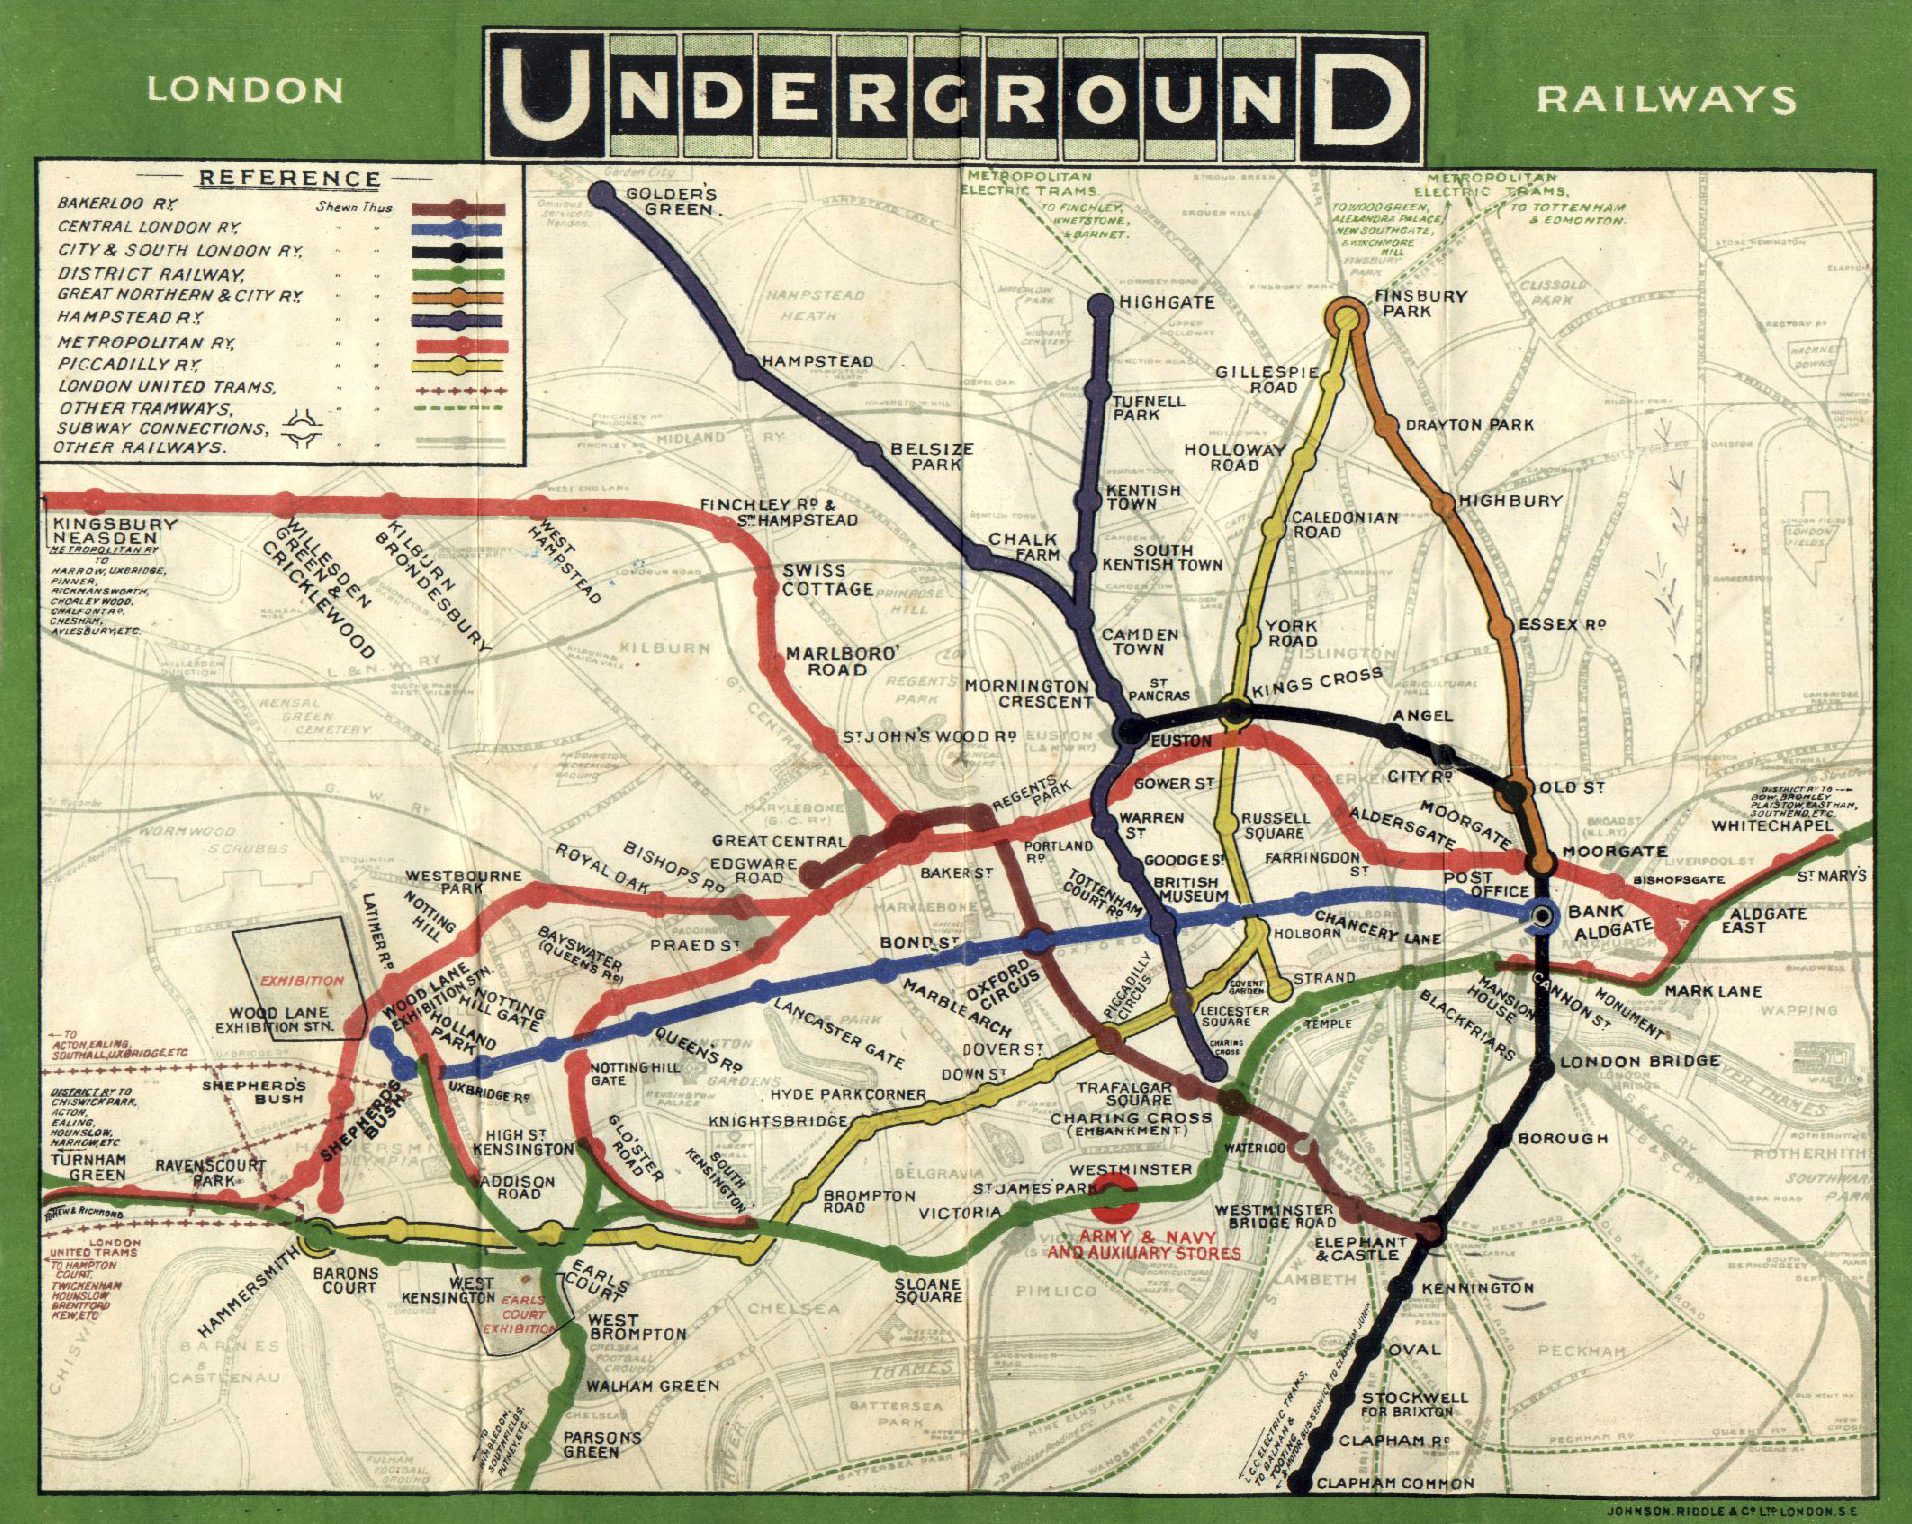
Kate's post (below this one) provides a very good insight into what makes spatial special - for her, a "picture is worth a 1000 words". When we were discussing the post, however, I thought I would also propose a complementary view. I guess my equivalent sentence would be "you may not need a map at all". Indeed, for me "spatial" would also include these:
and also these:
Working with spatial data offers a different way to understand your data that you couldn't achieve in a simple spreadsheet or text-based approach. In addition to that, 'spatial' for me goes beyond traditional geographical scales. You can look for different patterns, and answer questions such as 'what lies within 30km of here?' or 'what is next to this building?' or 'I want to build a new underground tunnel - who owns the land above me?', 'How can I get from A to B on the Underground?' If I had to list what makes spatial special, the list would focus more on what you can do with data in a GIS that you can't do elsewhere, which might include:
- topological operations - e.g. containment, intersection, adjacency, meets, touches
- networking operations - e.g. shortest path, travelling salesman
- metric operations - e.g. distance, area, volume
- topological consistency analysis - e.g. does the data have holes, slivers, undershoots and overshoots
and potentially others such as pattern detection, statistical analysis, spatio-temporal analysis and so forth. The results of this analysis may be presented as a map, but may be given in another form - a journey planner gives you a list of waypoints for your route, the population within a London Borough may be given as a number in a report.
If you think about it, Kate's view and mine have quite a bit in common, and probably reflect our different specialisations - amongst other things, Kate is a Usability and Human Computer Interaction expert, whereas my work focusses more on databases, 3D GIS and back-end programming. No doubt there are many more answers to the 'what makes spatial special' question too.
And for those of you who are interested - my PhD was about performance of topological analysis in 3D GIS. Here's an example of the visual output:
Images from:
- http://upload.wikimedia.org/wikipedia/commons/9/90/Tube_map_1908-2.jpg
- http://activerain.com/image_store/uploads/1/9/9/6/2/ar126056378926991.jpg
- http://t2.gstatic.com/images?q=tbn:ANd9GcQJvI_BjNgt2QSkemv5E7X7Nparv2mb1Bpvt52aErg2C-bnsRoE0w
- http://t0.gstatic.com/images?q=tbn:ANd9GcSbpUkXUCwxAaA6vWC04xVsAcpofaC9XbZYjF6BoPFG4OBaa7_O


No comments:
Post a Comment