Project Description


"This blog is updated by the JISC funded G3 Project (#jisc3g) team. We are building an framework for teaching and communicating relevant geographic concepts and data to learners from outside the world of geography and GIS. We think this blog will be of particular interest to those working or teaching in HE and FE and those interested in teaching and learning and e-learning."

|Read more about the project |

Friday 11 November 2011

What is the IIGLU product? (The final Product Post, not the last ever blog post)

IIGLU is more than just a piece of software!

Geographical Information Systems are hard to use – IIGLU makes them easier.

IIGLU stands for Interactive Integrated Geospatial Learning and Understanding.


This is a framework for teaching geospatial information concepts to learners outside the discipline of GIS. So how will IIGLU work for you?

Are you a teacher, lecturer or geospatial expert?
  • You will first need to develop a Use Case which will help your target audience understand geospatial concepts. Click HERE to see some examples – please feel free to make use of these yourself.

  • Once you’ve done this, you will need to build this use case into a e-learning scenario (the software environment is in alpha phase of development an will launch at the end of FEB 2012). This is a little like writing a script for a play – see HERE for examples of the preparation process and HERE for a video of how to build the scenario using the IIGLU tools.

  • The final part of your work is to bridge the gap between your scenario and a real GIS environment – you do this via the Wiki. Click HERE to see some examples of how.
Are you a learner new to geospatial / digital mapping?
  • We’ve developed a decision tool to help you find out where to start – click HERE to see how it works.
  • Links in the decision tool will take you to an e-learning environment, where you will be able to interact with maps, videos and text and learn how GIS concepts can be applied in your discipline. Click HERE to see a video of the e-learning environment
  • If you want to find out how to do the things you’ve learned about in a GIS software package such as ArcGIS, you can follow the links to the Wiki – click HERE for some examples.
Next Steps:

IIGLU is in Alpha development phase at the moment, with an expected roll out in Spring 2012.

Thursday 10 November 2011

Thoughts on how the IIGLU e-learning environment can be further developed in the Future

For the project team it feels like IIGLU is only just getting started and what we have developed is a proof of concept e-learning environment which we think has great potential. We have identified a couple of ideas for future development, which include: Within the e-learning software we are developing each learner interaction with the map window is currently being recorded by the software and stored in a database - we call this recording of tutorial states. This has potential in 2 directions:
  1. Delivering Feedback as Part of a Game Environment. Users will be able to step through the tutorials and as they complete tasks the system will deliver personalised feedback based on how successfully they completed it. This will be achieved via the use of a weights matrix (defined during user testing) that stores a tolerance ratio, which is the difference between the tutorial state of the teachers actions and the state of the learners interactions. So if the teacher writing the scenario asks the student to create a buffer that is 10m from the point of interest and the user types 15m they will be given points for drawing a buffer but not full points because the distance was wrong.

  2. Tutorial State Tracking & Usability Analysis for Indepth User Understanding: The recording of user interactions with the map tutorial state will enable us to explore how users are interacting with the tutorials and inform further usability analysis and understanding.
Extend tutorials to include more geospatial concepts: The e-learning environment is not replicating a desktop GIS but provides a facility for exploring geospatial concepts without the complex interaction functionality of a GIS. With this in mind there is scope to expand the tutorials which currently focus on the question "how do I make a map" to questions such as "how do I collect my data?", "how do I store my data?", "how do I analyse my data?"

Integrate external data repositories automatically into the spatial database: Currently teachers can upload data, in the form of KML files. which as part of the server side of the system are stored in a spatial database (POSTGRE SQL) a future extension to this would be enable users to automatically select data /upload from higher education repositories such as DIGIMAP, ShareGeo, UK Boarders

Project Blog Posts - Table of Contents

Development of our Product - IIGLU

Understanding Users:


Understanding User Interactions with Geographic Information and GIS

Teaching and Learning Geographic Information

IIGLU - The Elevator Pitch!

Geographical Information Systems (GIS) are hard to use – IIGLU makes it easier. IIGLU is an interactive online framework to support learning and teaching of geographic and GIS concepts.

If you want to make a map for the first time OR are interested in teaching students/new learners how to make a digital map with existing data - IIGLU will support you through the process.

For teachers, lecturers and geospatial experts

IIGLU helps you to develop a use case to describe the characteristics of your learners and identify their learning needs. You can develop and build e-learning scenarios for students to play back. Supporting students learn geospatial concepts without worrying about the complex interactions required of a desktop GIS. Finally to bridge the gap between the e-learning scenarios and a real desktop GIS package a wiki enables you to share your knowledge.

For new learners of geospatial/ digital mapping

IIGLU helps you learn how to make a map for the first time - you can use a decision support tool to guide your mapping choices. The IIGLU e-learning environment allows you to interact with maps, videos, text and images usng examples from specific disciplines to walk you through the conceptual framework of digital mapping. Finally you can apply your learning to desktop GIS using the knowledge base on the IIGLU wiki.

Thursday 3 November 2011

IIGLU - our logo

IIGLU is more than just a piece of software. IIGLU stands to Interactive, Integrated, Geographic, Learning and Understanding. It represents the result the of work the JISC G3 project has been conducting over the last month. We have been developing a framework for teaching geographical information concept to learners from outside the discipline.

We came up with the name as a take on the word Igloo because it is made of large building blocks which represent the steps of understanding in our framework. As you complete each step you build your understanding of the concepts that underpin digital mapping (desktop and web based). Also an igloo is sort of shaped like a globe, and this project is about geography and digital mapping so we wanted to incorporate a globe into the design.

As part of the frame work we are developing a tool to support new learners : for more information have a look at the post : an IIGLU is born.

Hope you like it!

Wednesday 2 November 2011

Yes, it is Possible to do a PhD in GIS without including any maps (or, what makes spatial speical - Claire's view)

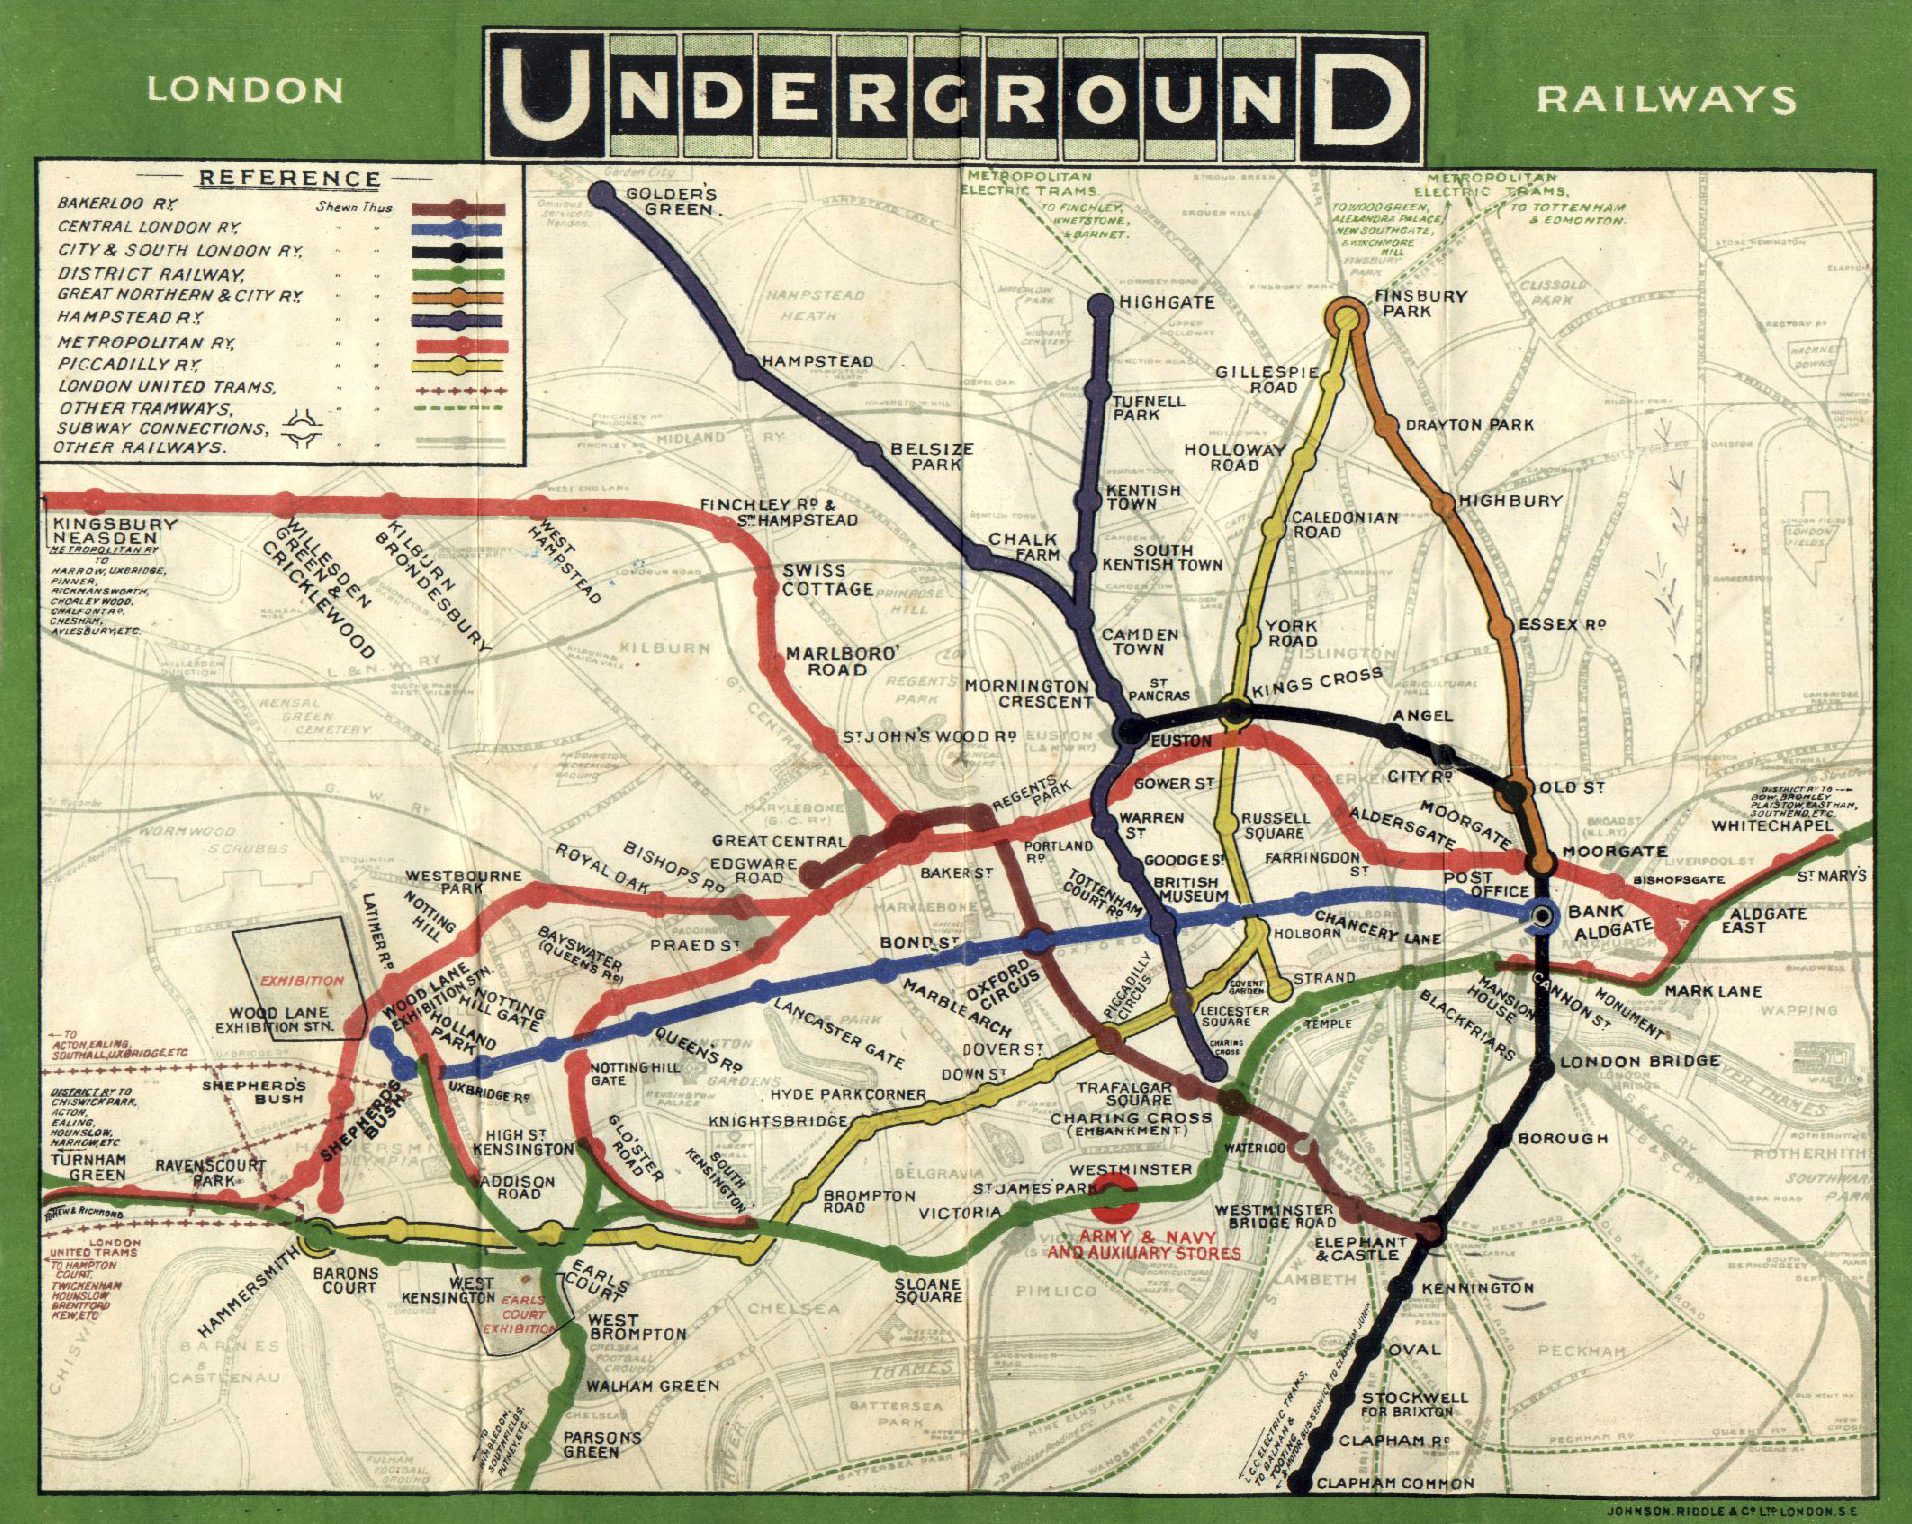
Kate's post (below this one) provides a very good insight into what makes spatial special - for her, a "picture is worth a 1000 words". When we were discussing the post, however, I thought I would also propose a complementary view. I guess my equivalent sentence would be "you may not need a map at all". Indeed, for me "spatial" would also include these:


and also these:


Working with spatial data offers a different way to understand your data that you couldn't achieve in a simple spreadsheet or text-based approach. In addition to that, 'spatial' for me goes beyond traditional geographical scales. You can look for different patterns, and answer questions such as 'what lies within 30km of here?' or 'what is next to this building?' or 'I want to build a new underground tunnel - who owns the land above me?', 'How can I get from A to B on the Underground?' If I had to list what makes spatial special, the list would focus more on what you can do with data in a GIS that you can't do elsewhere, which might include:
  • topological operations - e.g. containment, intersection, adjacency, meets, touches
  • networking operations - e.g. shortest path, travelling salesman
  • metric operations - e.g. distance, area, volume
  • topological consistency analysis - e.g. does the data have holes, slivers, undershoots and overshoots
and potentially others such as pattern detection, statistical analysis, spatio-temporal analysis and so forth. The results of this analysis may be presented as a map, but may be given in another form - a journey planner gives you a list of waypoints for your route, the population within a London Borough may be given as a number in a report.


If you think about it, Kate's view and mine have quite a bit in common, and probably reflect our different specialisations - amongst other things, Kate is a Usability and Human Computer Interaction expert, whereas my work focusses more on databases, 3D GIS and back-end programming. No doubt there are many more answers to the 'what makes spatial special' question too.


And for those of you who are interested - my PhD was about performance of topological analysis in 3D GIS. Here's an example of the visual output:


Images from:
  • http://upload.wikimedia.org/wikipedia/commons/9/90/Tube_map_1908-2.jpg
  • http://activerain.com/image_store/uploads/1/9/9/6/2/ar126056378926991.jpg
  • http://t2.gstatic.com/images?q=tbn:ANd9GcQJvI_BjNgt2QSkemv5E7X7Nparv2mb1Bpvt52aErg2C-bnsRoE0w
  • http://t0.gstatic.com/images?q=tbn:ANd9GcSbpUkXUCwxAaA6vWC04xVsAcpofaC9XbZYjF6BoPFG4OBaa7_O


Friday 14 October 2011

What Makes Spatial Special – my (Kate’s) perspective

When I started on our master’s degree in 2003 at University College London the first week was an induction week. We were introduced to each lecturer in the department (Prof Muki Haklay, Prof Paul Longley, Jeremy Morley and Dr John Illife) and were giving an introductory series of lectures called spatial is special – I still remember them reasonably well. The notion of spatial is special is one of the first discussions included in GIS texts and introductory lectures. So, let’s consider the conventional reasons for why spatial is special, they include:

  • Geographic data is multi dimensional
  • There are lots of it – it is voluminous
  • It can be represented at multiple scales
  • It requires a projection system to turn a 3D real world into an 2D computer model or paper map
  • Special analysis techniques are required – nearest, furthest etc
  • It can be laborious and time consuming to collect, process and analyses
  • It is expensive and complex to maintain up to date geographic data
  • I t is cross –disciplinary in nature and can be used to link disciplines

(adapted from Longley, Goodchild, Maguire & Rhind (2011). Geographical Information Systems and Science, John Wiley and Sons: Chichester)

This is the technical response, but there is an emotive reason behind why spatial is special, and for me it is related to the age old adage “A picture tells a 1000 words”. Here in Portsmouth I teach to undergraduates in lectures with 200 students. I see my job as inspiring enthusiasm for exploring issues in human geography and I do this by finding relevant maps, images and TED talks to bring subjects/sub-disciplines to life.

For reasons unbeknown to me, there is a consensus amongst our undergraduate cohort that they don’t like GIS/ Geospatial data/ making maps. This bothers me, I am a map geek and I hope to inspire them to change their mind. So, even if the students don’t remember my name, they know me as the one that uses a map(s) in every lecture. Why do I do this? Good maps bring abstract concepts, theory and data to life. They help stimulate the imagination and aid knowledge production. They simplify and generalise complex issues in ways that members of the public and new learners can understand. It is inconceivable for me to imagine giving a lecture on migration without the aid of maps to illustrate movement.

How do I benchmark a successful lecture with 200 students? Students are not fiddling with their phones, whispering to each other, falling asleep or slouched in their seats. If they are engaged, attentive and interested it shows on their faces and in their posture. Last year, I remember giving a lecture on the subject an “Introduction to GIS and health”. There are so many powerful maps that can be used in this subject area, examples include:

  • John Snow’s map of Cholera
  • Changes in life expectancy as you travel from tube stop to tube stop
  • Patterns of malaria across Africa
  • Sptaial-temporal maps of population differences
  • Noise mapping in low income neighbourhoods of London
  • Mapping Internally Displaced People (IDP) in Haiti
  • Cartograms of population to reveal inequalities


When such maps are used in lectures to illustrate and communicate concepts and bring geographic data to life – the reward is a positive student reaction and a realisation that maps are useful. This is particularly evident if lectures reflect real world issues in the news. This lecture was delivered this year at the time of the during this lecture we also discussed the Fukushima nuclear accident in Japan – highlighting health issues of such a crises and then looked at how different maps and mapping hacks of the incident could be used to explore at risk population groups. This type of linking between maps and real world issues bring to the fore the potential of geospatial applications for decision-making and problem solving issues in human geography.